Introduction
Understanding how to analyze the financial markets is crucial for making informed trading decisions. Whether you’re trading Forex, Stocks, or Cryptocurrencies, two primary methods dominate the market: Technical Analysis and Fundamental Analysis.
- Technical Analysis focuses on price movements, historical trends, and market psychology, using charts and indicators to predict future price action.
- Fundamental Analysis examines macroeconomic data, company earnings, and news events to determine the intrinsic value of an asset.
Traders often debate which method is better, but the most successful traders combine both to maximize their chances of success. In this guide, we’ll break down the key components of Technical and Fundamental Analysis and how you can use them to enhance your trading strategy.
1. What is Technical Analysis?
1.1. Understanding Price Charts & Trends
Technical Analysis (TA) is based on the idea that market prices follow patterns, and history tends to repeat itself. By analyzing charts, trendlines, and indicators, traders can identify potential entry and exit points for profitable trades.
Types of Price Charts Used in Technical Analysis
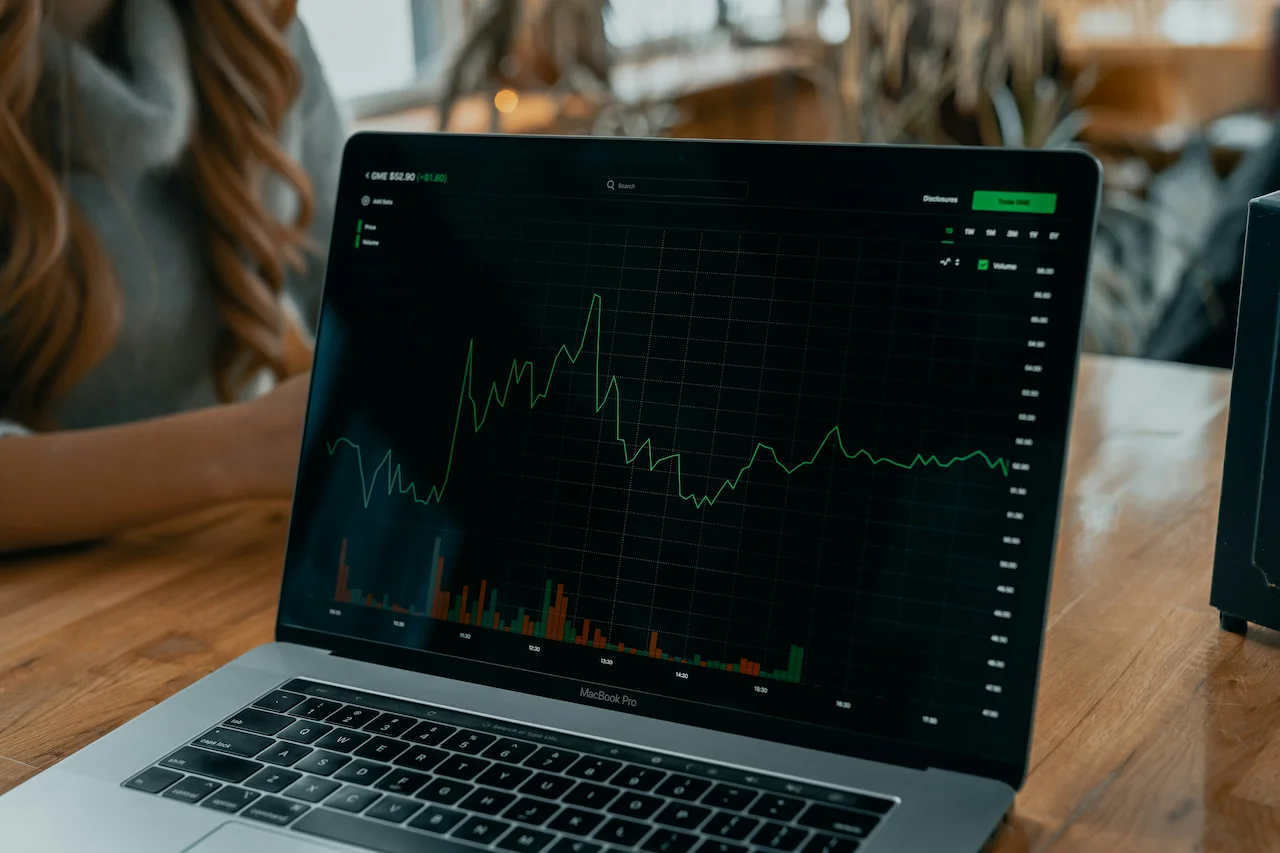
Line Chart – A simple chart that connects closing prices over a period, useful for identifying long-term trends.
Bar Chart – Displays the open, high, low, and close (OHLC) prices for each time period.
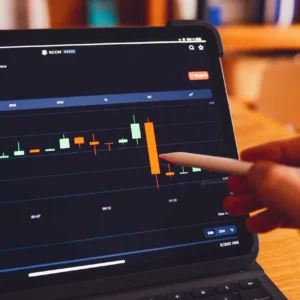
Candlestick Chart – The most popular chart type, visually representing price action with bullish (green) and bearish (red) candles.
Identifying Trends:
- Uptrend (Bullish Market) – Prices make higher highs and higher lows.
- Downtrend (Bearish Market) – Prices make lower highs and lower lows.
- Sideways Market (Range-bound) – Prices fluctuate within a horizontal range, showing no clear trend.
💡 Tip: Always trade with the trend for a higher probability of success.
1.2. Key Technical Indicators & How to Use Them
Moving Averages (MA) – Smooths price data to identify trend direction.
- Simple Moving Average (SMA) – Averages closing prices over a set period (e.g., 50-day SMA).
- Exponential Moving Average (EMA) – Places more weight on recent data, making it more responsive to price changes.
📌 Use Case: A price crossing above the 200-day SMA often signals a bullish trend.
Relative Strength Index (RSI) – Measures market momentum on a scale of 0-100.
- Above 70 = Overbought (potential reversal downward).
- Below 30 = Oversold (potential reversal upward).
📌 Use Case: RSI divergence (price moves up while RSI moves down) often signals a trend reversal.
MACD (Moving Average Convergence Divergence) – Shows momentum shifts.
📌 Use Case: A bullish MACD crossover (signal line crosses above the MACD line) can indicate a buying opportunity.
Bollinger Bands – Identifies volatility and overbought/oversold conditions.
📌 Use Case: When price touches the upper band, it may be overbought, and when it touches the lower band, it may be oversold.
1.3. Support & Resistance Levels
📌 Support Level: A price zone where buying interest is strong enough to prevent further declines.
📌 Resistance Level: A price zone where selling pressure is strong enough to prevent further increases.
💡 How to Use It:
- Buying near support levels can offer a good risk-reward ratio.
- Selling near resistance levels can help lock in profits before a pullback.
📌 Example: If Bitcoin repeatedly bounces around $40,000, that level may act as a strong support zone.
2. What is Fundamental Analysis?
Fundamental Analysis (FA) helps traders understand the true value of an asset by evaluating economic data, financial reports, and global news.
2.1. How Fundamental Analysis Works in Forex Trading
Forex traders analyze macroeconomic indicators that impact currency valuations, such as:
📌 Interest Rates – Higher interest rates attract foreign investment, strengthening a currency.
📌 Inflation Data – Rising inflation often weakens a currency unless countered by rate hikes.
📌 Gross Domestic Product (GDP) – Strong economic growth typically strengthens a country’s currency.
📌 Employment Reports (e.g., NFP in the U.S.) – A strong labor market supports economic growth and a stronger currency.
💡 Tip: Monitor the economic calendar for major reports, such as:
- FOMC Meetings (Federal Reserve interest rate decisions).
- ECB & BOE Announcements (Central bank policies in Europe).
- Non-Farm Payroll (NFP) – Key employment data from the U.S.
2.2. Fundamental Analysis in Stock Trading
Stock traders use financial reports and economic data to evaluate companies. Key indicators include:
- Earnings Reports (EPS) – Higher earnings per share (EPS) indicate stronger profitability.
- Price-to-Earnings (P/E) Ratio – A lower P/E ratio can signal an undervalued stock.
- Dividend Yield – High dividend payouts attract long-term investors.
- News & Market Sentiment – Positive earnings or a strong CEO announcement can boost stock prices.
📌 Example: If Apple (AAPL) releases strong earnings, its stock price may surge.
2.3. Fundamental Analysis in Crypto Trading
Since cryptocurrencies lack earnings reports, traders focus on:
- Project Utility & Roadmap – Does the crypto have real-world applications?
- Adoption & Institutional Interest – High adoption rates can drive demand.
- Regulatory News – A government ban can crash prices, while approval boosts sentiment.
- Market Sentiment & Social Media Hype – Influences speculative trading (e.g., Elon Musk tweets about Dogecoin).
- Example: If Ethereum 2.0 successfully launches, ETH prices could rise due to increased adoption.
3. Combining Technical & Fundamental Analysis for Better Trades
The best traders use both technical & fundamental analysis:
- Technical Analysis helps identify short-term trade opportunities.
- Fundamental Analysis confirms long-term trends & intrinsic value.
📌 Example: If Bitcoin’s price breaks above resistance and fundamentals show institutional adoption, it may indicate a strong buy signal.
💡 Tip: Always check both price action and economic/news events before executing a trade.
Final Thoughts & Next Steps
Both Technical and Fundamental Analysis are powerful tools that help traders make data-driven decisions. To master the markets:
- Learn technical indicators and price patterns.
- Follow economic calendars & earnings reports.
- Develop a risk management strategy to protect your capital.
- Stay updated with global market news & geopolitical events.
🚀 Ready to improve your trading? Start analyzing charts, news, and trends today!